
By Lawrence G. McMillan
This article was originally published in The Option Strategist Newsletter Volume 7, No. 12 on June 25, 1998.
With the frequent number of 100-plus point moves in the market – some in each direction – there has been a growing number of commentaries regarding market volatility. However, there has been very little, if any, discussion of just what to expect from the market at these levels. In this week’s article, we’re going to take a look at various measures of market volatility, and then see if we can determine what kind of volatility is “normal” for various scenarios.
The best way to measure market volatility is statistically. That’s what we call the “historic” volatility. It measures how fast the market has been moving around in the past. This is a pretty standard concept, but most people don’t have a clue as to what it means. For example, if we determine that the 20-day historical volatility of the Dow-Jones Averages is 15%, what does that mean to the average investor? Practically nothing. If we add the information that the market “normally” has a volatility of about 15%, then that would be helpful – we can see that for the last 20 days things have been “normal”. But, even so, what does the “15%” number mean? Unfortunately, it’s rather nebulous since it’s a statistical term. Simplistically, it means that there’s a 67% chance that the market will be within 15% of today’s levels a year from now.
That’s probably more than you wanted to know. In fact, I usually encourage people to just use the number for comparison – so if we know that the Dow ($DJX) has a historical volatility of 15% and we see that the Semiconductor Index ($SOX) has a historic volatility of 30%, then we can conclude that $SOX is about twice as volatile as the Dow.
Before we get into this next phase of the discussion – and before you look at the data below – please take out a pencil and write down a figure that you think represents the maximum number of points that the Dow could be up or down at some time on an average day (i.e., it will make that much of a move about half of the time), assuming we’re at current levels – about 8900 on the Dow.
Obviously, the higher the historic volatility number, the greater the price swings that can be expected – whether they be measured intraday, daily, weekly, monthly, or in longer terms. The following table should be useful for determining how large a daily move you might expect from the Dow, given a certain level of historic volatility. You can always get the most recent historic volatility figures for $DJX or any of the other nearly 3000 underlying instruments on which options are traded, by visiting the historic volatility data section of our web site here. We update not only the historic volatility in three different lengths (10-day, 20-day, and 50- day), but also the implied volatility, and we give you the percentile of implied volatility as well (on the site). Moreover, for stock and index options, you can also find the symbols for options quotes – including wrap symbols for indices, option symbols after splits, and option symbols for NASDAQ stocks.
The way to read the above table is this: find the spot in the table where the Dow is currently (at 9000), and the 20-day historic volatility (H.V.) is 12%. You can see that there is a “65" in the table at that spot. This means, that – “on average” – you can expect the Dow to either be 65 points higher or 65 points lower at some time during a single trading day, given those parameters of 9000 and 12% (this does not mean that the Dow will close at that level -- just that it will be there at one time during the day). The phrase “on average” means that the Dow should be able to make that move on 50% of its trading days.
Recently, the historic volatility of the “market” has been increasing as we’ve swung back and forth from one side of this trading range to the other. So, we’re almost at the point where we can expect 100-point intraday moves about half of the time. Let’s get specific and look at this scenario using current market data.
As of this writing, the 20-day historic volatility of the Dow is 17% (as it is for $OEX, while $SPX is 16%). Also, the Dow is at 8900. Interpolating the table, this would give you a daily move of about 92 points. Thus, it is to be expected that – given current market conditions – the Dow can move 92 points higher or lower about half the time. This is probably a larger number than you had in mind (do you remember what you chose for this figure when you were asked to write it down?). I find it somewhat surprising -- even understanding the math -- that such big moves are expected to be so commonplace. And, if the market moves higher, it will only get bigger – even if historic volatility declines a little.
So, don’t be disturbed by the size of today’s moves and don’t be confused by the media’s preoccupation with such moves. As you can see, they are really quite “normal” although the definition of “normal” keeps sliding upward as the market gets higher and higher (or if it gets more volatile).
Another thing that’s important when talking about volatility, of course, is implied volatility. The previous discussion tried to determine what is “normal” for actual, or historic, volatility. Now, let’s take a look at what might be considered a “normal” implied volatility for the “market”. Implied volatility is the option market’s assessment of future volatility. And the option market can often be wrong -- that is, implied volatility can actually differ from historic volatility for long periods of time. It’s always extremely important for an option trader to know where implied volatility is when he trades options. In some cases, implied volatility is almost always wrong. A case in point is that of $OEX – where implied volatility is often higher than historic volatility.
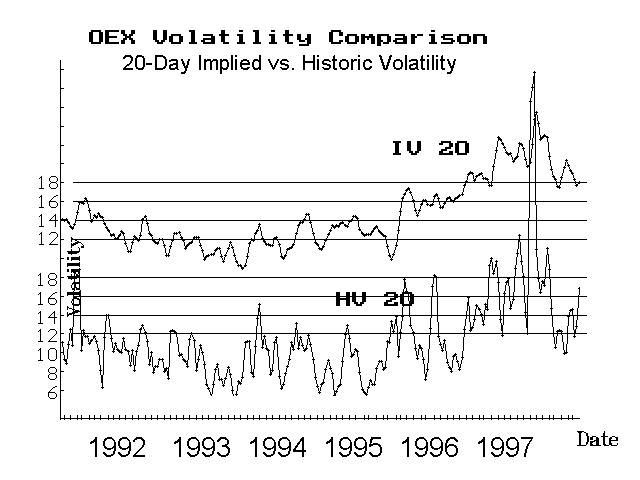
For example, look at the previous chart. It shows the historic volatility of $OEX over the past 6+ years on the lower curve, and the implied volatility of $OEX on the curve above that. NOTE: this is a composite weighting of all $OEX options – not just the few that are used to compute the CBOE’s Volatility Index ($VIX). Therefore, these implied volatility figures differ from $VIX, although they tend to have peaks and valleys at the same times. This calculation of $OEX implied volatility is computed in the same manner that all of our other implied volatilities are calculated daily – for stock, index, and futures options.
Refer once again to the two lines on the previous chart. The two – implied and historical volatility – have been separated, so that you can see them more easily, but the scale is repeated on the left-hand side of the chart. The parallel lines across the page should help you compare the two. If you look carefully, you will see that implied volatility is almost always higher than historic volatility – except for some occasional spikes upward by historic volatility.
As examples, look at 1993, where historic volatility was below 8% for an extended period of time, and was as low as 6% a couple of times. Implied volatility during the same time period was never that low. Or look at 1997. Implied volatility was well above 18% all year, while historic volatility spent much of the year below that level. Then, this year (on the far right hand side of the chart), implied volatility has been at 18% or higher all year, while historic volatility just recently rose above 16%.
These observations leads to a severe conclusion: when you trade an $OEX option, it is almost always overpriced. That’s great for option sellers, but is disastrous over the long run for option buyers. That’s why a lot of institutions have stopped buying $OEX puts for protection and are concentrating their efforts these days into buying regular stock puts. The same effect holds true for many other “broad market” indices and their options. Also, this phenomenon makes it much harder for the option buyer to make money in $OEX than the option seller. This same comment can be made about most index options, so be careful when you trade them.
You might think that there is no harm in buying these overpriced options because they seem to remain overpriced almost all the time. That’s true in the short run, but as expiration approaches, the true (historical) volatility is the ultimate control of prices and the options must lose their volatility to fall in line with the lower historical volatility by the end of the option’s life.
Why are $OEX options always so “mispriced”? There are a couple of reasons. One is that it’s much easier to trade a “market” option such as this, rather than buying a lot of different equity options to try to duplicate the same result. That increases demand. Another is that most clearing firm and brokerages have made it onerous to sell naked $OEX options, so there is less of a supply than there was before the crash of ‘87. More demand, decreased supply.
This is not to imply that you can’t make money buying index options ($OEX, in particular) – obviously a sizeable move in your favor will result in profits – but you are sort of fighting an uphill battle, statistically. The question that one must ask, though, is “If I have a ‘market’ buy signal, should I just go ahead and buy $OEX calls, or should I try to pick a group of ‘cheaper’ equity call options?” The latter approach is what traders had to do before there were listed index options (i.e., before 1982). Believe me, it’s not an easy task; it can be quite disconcerting to be “right” on the market, yet to see that the stocks you have picked to play the market are doing nothing while the averages move the way you thought they would.
So, the bottom line is that it may still be worthwhile to trade the $OEX options, even though they’re expensive, if you have a reliable trading system. That is, if you think you have a pretty good chance of being correct with your market opinion, then it may be the okay to buy $OEX options. Otherwise, stick to selling or spreading them, and use equity options for your outright directional strategies, because they’re cheaper in general.
This article was originally published in The Option Strategist Newsletter Volume 7, No. 12 on June 25, 1998.
© 2023 The Option Strategist | McMillan Analysis Corporation