The Probability Calculator

Simulate the probability of making money in your stock or option position.
McMillan’s Probability Calculator is low-priced, easy-to-use software designed to estimate the probabilities that a stock will ever move beyond two set prices—the upside price and the downside price—during a given amount of time. The program uses a technique known as Monte Carlo Simulation to produce estimates that assess the probability of making money in a trade, but can also be used by traders to determine whether to purchase or sell stock, stock options, or combinations thereof.
What makes McMillan’s Probability Calculator different?
Over a number of trading days, the price of a stock may vary widely and still end up at or near the original purchase price. Many calculators are available that give the theoretical probability that a stock may approach certain values at the end of a trading period. In real trading, however, investors are following the price of a stock or stock options throughout the entire trading period. If the stock, stock options, or combination becomes profitable before the end of the trading period (for example, before the expiration of some stock options), it is reasonable that a trader may decide to reap part or all of those profits at that time. The Probability Calculator gives the likelihood that prices are ever exceeded during the trading period, not just at the end.
What is Monte Carlo Simulation?
Monte Carlo is, of course, the famous gambling city in the small European country of Monaco. If you had an unlimited amount of money, you could go to Monte Carlo and play the same number on, say, a roulette wheel multiple times. After a large number of times (each time is called a “trial”), you would have a good estimate of how likely it is that your chosen number would appear.
The Monte Carlo Simulation technique can be thought of as spinning a computer-based roulette wheel, and counting how many times a certain outcome occurs. The secret to success is to program your “computer roulette wheel” to emulate whatever real-life process it is that you are trying to learn about.
For The Probability Calculator, the computer is emulating the daily changes in stock prices, based on the model developed by Black & Scholes in their Nobel Prize-winning work on options. For each trial, the computer will randomly emulate the changes in stock prices that could occur for a number of trading days. It uses the supplied volatility number to determine how far a stock might move on a particular trading day.
How to use The Probability Calculator
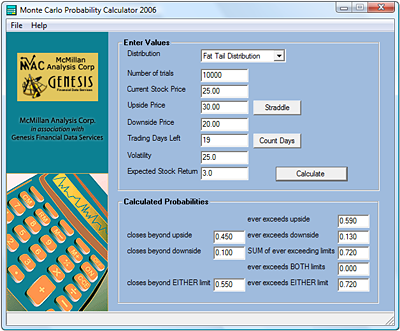
The Probability Calculator is actually quite easy to use. Simply enter the following values into the software:
- Distribution: Select the distribution type to be used in the simulation, choosing either Lognormal Distribution or Fat Tails Distribution. Mathematicians have realized for decades that stocks move in a lognormal fashion, and that is the distribution used in the Black-Scholes Model. However, in real life, stocks move with a fat tails distribution, which is quite similar to lognormal, but it allows for the possibility of larger moves at the far ends of the spectrum (i.e., large rises in price or large declines in price) than would normally be predicted by lognormal movement. The Fat Tails Distribution used in this calculator comes from observed movements in the stock market. Experiment with this choice. You will see that the results are not all that different, but that the fat tails distribution allows for slightly larger stock movements than the lognormal distribution does.
- Number of trials: Enter the number of trials you want the program to conduct. The default number of trials is 10,000. We do not recommend using less than 10,000 trials. The more trials you run, the more accurate an estimation you will get, but the longer it will take to do the calculations. 10,000 trials are usually sufficient.
- Current stock price: Enter the current price of the underlying security.
- Upside price/ Downside price: Enter the desired prices that the stock would need to reach for your trade. Most often, this is the price needed in order for you to “break even.”
- Trading Days Left: Enter the number of trading days you wish to consider. For stock options and combinations (such as straddles), this is the number of trading days left until the options expire. For ease in calculating the number of trading days until an option expires, click on the Count Days button which calculates the trading days between two given dates.
- Volatility: Enter the historical volatility of the underlying security. The 20-day historical volatility is usually a good estimate. Volatility is entered as a percentage; that is, 25.3% is entered as 25.3.
- Expected Stock Return: Also commonly called "drift." It is expressed as an annual percentage. For longer-term calculations, it can be important, but it is not meaningful for short-term calculations. This allows for the fact that a stock (or the stock market) has a natural tendency to rise in price, say by an amount equal to the risk-free interest rate. So, if you wanted to input 3% as the "drift," you would enter 3.0 -- meaning that this stock has a tendency to rise 3% per year on its own.
What Do the Results Mean?
You will be given eight results each time you run a calculation. The first three are: closes beyond upside, closes beyond downside, and closes beyond EITHER limit, which deal with where the price was at the close of your trading period. The other five results deal with prices during the trading period. They are: ever exceeds upside, ever exceeds downside, SUM of ever exceeding limits, ever exceeds BOTH limits, and ever exceeds EITHER limit. A brief explanation of each result follows.
- Closes beyond upside: This is the probability that the underlying security will be above the upside price at the end of the trading period.
- Closes beyond downside: This is the probability that the underlying security will be below the downside price at the end of the trading period.
- Closes beyond EITHER limit: This is the sum of the two previous results. This is the probability that the underlying security will be above the upside price or below the downside price at the end of the trading period.
- Ever exceeds upside: This is the probability that the underlying security will ever exceed the upside price during the days of the trading period.
- Ever exceeds downside: This is the probability that the underlying security will ever trade below the downside price during the days of the trading period.
- SUM of ever exceeding limits: This is the sum of the two previous results. Because the price may exceed both limits during a trial, this sum can be greater than 100%, which may seem confusing initially. This value is used with the next result (ever exceeds BOTH limits) to determine the final probability of exceeding either limit.
- Ever exceeds BOTH limits: This is the probability that the underlying security will ever hit both price limits during the trading period.
- Ever Exceeds EITHER limit (SUM - BOTH): As indicated, this is the difference between the SUM result and the BOTH result, above. This is interpreted as the overall probability that the price will ever exceed either limit at some time during the trading period. This result is particularly useful when analyzing straddles.
More about The Probability Calculator:
- Uses Monte Carlo Simulation
- Choose between Lognormal or Fat Tails Distribution
- Includes Drift for long term studies
- Date Calculator functions
- Ability to print results
- Extensive Help menu provided
System Requirements
PC-Operating System Compatible: Windows® 2000, XP Home, XP Pro, 2003 Server, Vista, Windows 7 (download only), Windows 8 (download only), Windows 10* (download only).
*NOTE: Software will not run on any MAC OS. The CD-Rom will not work on Windows 7, Windows 8, and Windows 10. To install on Windows 7, Windows 8, or Windows 10 choose the DOWNLOAD option.


© 2026 The Option Strategist | McMillan Analysis Corporation