The Expected Return Calculator

Use statistical analysis to evaluate potential positions
The Expected Return Calculator is McMillan’s proprietary analytical software that uses statistical analysis to evaluate complex option positions, in order to give the trader an idea of whether or not there is a probability of success in a trade.
What is Expected Return?
Expected Return is the return one could expect to make from a position over a large number of trials. Unfortunately, in the real world, each position we invest in has only one result – not a large number of results that we can average. However, in the long run, if one consistently invests in positions with superior expected returns, then he should show superior returns in his portfolio or trading account. All the facets of a strategy are incorporated into expected return – in particular, the probabilities of making or losing money and the size of profits or losses are both factored in.
Why use the Expected Return Calculator?
The results from The Expected Return Calculator can easily help investors and traders decide whether a particular option position is worth establishing. Furthermore, expected return analysis is the only way that a trader can accurately compare different strategies to see which is best: is a diagonal spread or a covered write the best trade? Or maybe a simple option purchase is best. Expected return can help you decide.
How to use The Expected Return Calculator
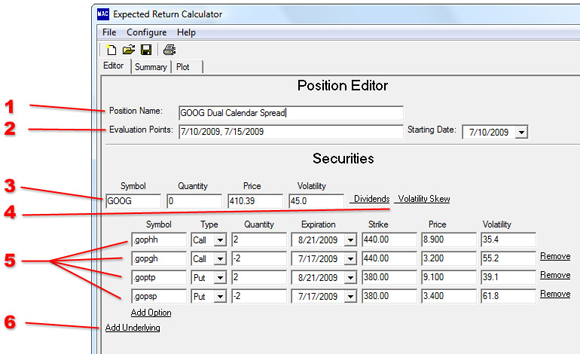
First, the trader defines his position, which can be extremely complex – involving multiple options and expiration dates, as well as a possible linear volatility skew.
-
Name the position for your own reference.
-
Enter the specific dates you would like to use for your position’s “Evaluation Points” along with the starting date.
-
Provide information about the underlying security, including the Symbol, Price, and Historical Volatility.
-
Enter any dividend or volatility skew information that pertains to the position you are analyzing.
-
Enter the information for each leg of the option position, including Option Symbol, Type (put or call), Quantity, Expiration, Strike Price, Option Price, and Option Implied Volatility (implied volatility can be set to 0 and be automatically calculated).
-
Multiple underlying can be incorporated into the position as well by use of the “Add Underlying” button.
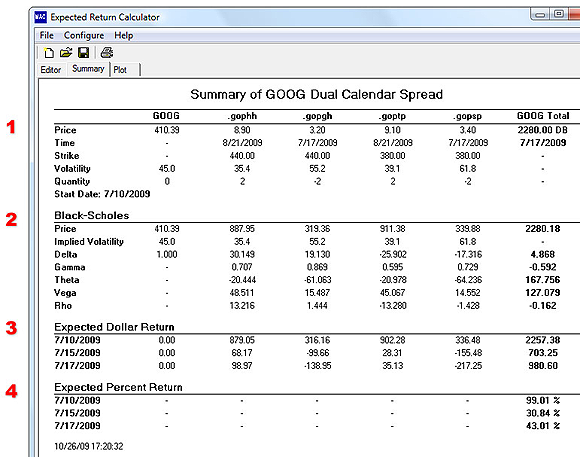
Click the “Summary” tab and outputs are calculated swiftly and accurately, and all can be printed and exported to Excel. Tabular outputs include position “greeks” as well as expected profit calculations at any number of user-defined dates during the life of the position.
-
A summary of your inputs is provided.
-
The Greeks, including Delta, Gamma, Theta, Vega and Rho are calculated and presented.
-
The Expected Dollar Return is shown at each data point for each leg and the entire position.
-
The Expected Percentage Return is provided for the entire position at each data point.
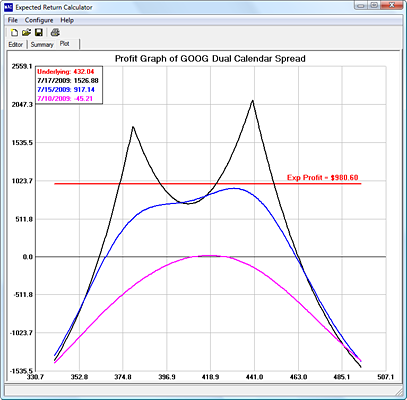
Under the “Plot” tab, graphical outputs show how the position is expected to behave at the user-defined intervals. The Expected Return calculator allows you to easily visualize exactly how much money you’d expect to make or lose at any underlying price and at any time throughout the life of the position.
More about The Expected Return Calculator:
- Analyze complex positions involving multiple options
- Encompasses volatility skews
- Date Calculator functions
- Profit/Loss Graph, including user-defined time lines
- Expected profit clearly marked on profit graph
- Legend on profit graph allows easy identification of important data points
- Tabular display of profit information available as well
- Position “greeks“ are shown
- User-defined commission rates allowed
- Outputs can be exported to Excel
- Save data files to your hard drive
- Print functions available for all outputs – graphic or tabular
- 30-page User Manual included under Help Topics
System Requirements
PC-Operating System Compatible: Windows® 2000, XP Home, XP Pro, 2003 Server, Vista, Windows 7* (download only), Windows 8* (download only), Windows 10* (download only).
*NOTE: Software will not run on any MAC OS. The CD-Rom will not work on Windows 7, Windows 8, and Windows 10. To install on Windows 7, Windows 8, or Windows 10 choose the DOWNLOAD option.
Installation Instructions
The software is delivered as a downloadable ZIP file. After downloading the file to your computer:
- locate the file and do one of the following:
- To extract a single file or folder, double-click the compressed folder to open it. Then, drag the file or folder from the compressed folder to a new location.
- To extract the entire contents of the compressed folder, right-click the folder, click Extract All, and then follow the instructions.
- Double click the ExpReturnSetup.exe to file to run the software installation.


© 2024 The Option Strategist | McMillan Analysis Corporation