By Lawrence G. McMillan
With the “fiscal cliff” dominating the news, the media tries to link every market wiggle to what some politician has just said about it. Meanwhile, there are plenty of real market forces that are influencing the stock market, but those seem to only be of interest to participants who aren’t media addicts – i.e., only a few. It is our contention that these “real” factors are what is actually driving the market.
By Lawrence G. McMillan
Now that $SPX has closed above 1410 on a closing basis, that is a bullish upside breakout. There is further overhead resistance at 1430, and then it is possible that the market could try for the yearly highs near 1470.
Equity-only put-call ratios are solidly on buy signals. They turned quickly from uptrends to downtrends, just last week.
Market breadth indicators have swung back and forth with short- term movements. But now they are solidly on buy signals.
By Lawrence G. McMillan
MORRISTOWN, N.J. (MarketWatch) — While there are still some mixed signals for stocks, some very powerful signals have lined up so that the bulls once again have a chance to take control of this market.
By Lawrence G. McMillan
The market, as measured by the Standard & Poors 500 Index (SPX) has been in a steady decline since mid-October. There is resistance in the 1395-1410 area, and that must be overcome for the picture to become bullish.
Both equity-only put-call signals have now rolled over to buy signals!
The stock market got quite oversold near the recent lows. Now, Monday's strong oversold rally gave birth to actual buy signals from the breadth oscillators.
By Lawrence G. McMillan
Today's early market action was a continued grind higher as further shorts were forced out of their positions. $SPX made the intraday high just below 1390, the upper end of resistance from 1380-1390. Around 1:00pm EST the Fed Chairman finished up a speech that apparently the market didn't enjoy. This triggered a wave of selling that brought the market down. Despite the sharp midday selloff, we still believe this rally may have some more room to the upside, likely a test of firm resistance in the area of 1400 and slightly above.
By Lawrence G. McMillan
The stock market has continued to decline rather sharply this week. As a result, the support at 1370 was broken -- yet another major support level giving way. The next major support level is likely to be 1330, which is the lows of last July (see Figure 1).
The equity-only put-call ratios are moving to the higher levels of their charts now (Figures 2 and 3), and in a sense, that is oversold. However, they are clearly still on sell signals since they are trending higher.
By Lawrence G. McMillan
The bears have finally managed to take control of the stock market, mostly due to some worries about upcoming economic and regulatory issues. However, the market has quickly gotten oversold, so a bounce may be forthcoming in the near future.
By Lawrence G. McMillan
The stock market, as measured by the Standard and Poors 500 Index ($SPX) continues to break down through important support levels. It is the close below 1395 that matters. This should activate targets as low as 1330, although it probably won't be in a straight line, for $SPX worked back and forth between 1330 and 1370 in July, and that range should provide some support.
By Lawrence G. McMillan
Stocks are trying to make sense of the election results, the newly bad news out of Europe, and the potentially foreboding “fiscal cliff.” This resulted in some very volatile action in the market Wednesday — especially if one also includes the overnight session in the S&P futures last night.
By Lawrence G. McMillan
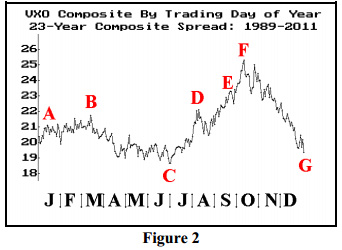
We occasionally publish charts showing the seasonal pattern of $VIX. Figure 2 below shows the composite price of $VIX for a 23-year history (1989 through 2011). This chart is constructed simply by following this method: gather the 23 $VIX prices for the first trading day of the year, sum them, divide by 23, and that is the first point to plot on the left of the graph. Continue that way throughout the year.