
By Lawrence G. McMillan
This article was originally published in The Option Strategist Newsletter Volume 10, No. 21 on November 8, 2001.
Recently, we have been receiving a number of inquiries from stock holders who are intrigued by the idea of selling covered calls against a core portfolio of stocks. Several factors in the overall marketplace have piqued this interest: the bear market, the relatively high level of premiums that exists currently, the low level of dividend payouts on most stocks, and just a general feeling among stock holders that they need to “do something” to improve what is now going on two years of dismal results.
As a strategist, I would advise these people to sell their stocks and embark on the strategy of volatility trading. As a practical matter, though, that would be inappropriate advice for most of them; it would be too radical of a change in investment philosophy. Rather, these stock holders would prefer to hold onto their portfolio in general and are looking for an option overwriting program to bring in some money which can be thought of as either increased income or as a modicum of downside protection. Overwriting means that one sells covered calls against a portfolio of stocks that he already owns
The Stocks Could Be Called Away
While an overwriting program can be structured in any number of ways, it must begin with one firm fact: the owner of the stocks must realize that it is possible that his stocks could be called away and he must agree to that proviso. If one is unwilling to let his stocks be called away, then he should not participate in a program of selling calls against that stock. To do so would essentially mean operating a program of naked call selling (the calls are covered for margin purposes, but they are naked in the stock owner’s mind because he refuses to sell his stock).
Once that hurdle has been cleared, the typical approach is to sell slightly out-of-the-money calls against the portfolio. The main question that the stock holder asks me at this point is “How much money can I expect this portfolio to generate, in terms of covered calls sold?” That, of course, is the pertinent question. Often, the stock holder has false perceptions about just how much money the covered calls will bring in. However, it is imperative for anyone running an overwriting program – whether it be the stock holder himself or an independent money manager – to have a realistic expectation of just how much money the portfolio can generate.
So, the following dialogue will go over the appropriate steps that one should take in order to attempt an accurate prediction of what an overwriting program will accomplish.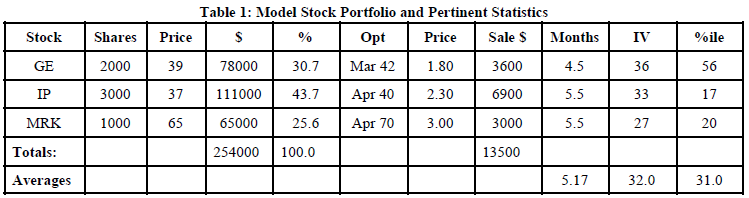
Analysis of Calls To Be Written
Table 1 shows a model portfolio of a few blue chip stocks and pertinent data regarding those stocks. Prices approximately equal to current prices were used. Reading from left to right, the columns in the table are Stock Symbol, Shares Owned, Price of the Stock, Dollar Amount of that stock ($), Percent that the stock is of the entire portfolio (%), call Option to be sold, Price of the call, Dollars received from call sale (Sale $), Months until expiration of the call, Implied Volatility of the call (IV), and the current percentile (%ile) of that stock’s options.
This portfolio consists of only three stocks, and they make up slightly different percentages of the total holding (see %column). The net asset value of the portfolio is $254,000.
There is certainly some subjectivity concerning which option to sell. In this table, options that were slightly out of the money were chosen. In addition each option has an expiration date approximately 5 months hence. Most stock holders who become overwriters prefer to use the out-of-the-money option so that there is a slightly greater than 50% chance that the option will expire worthless and they will retain their stock. That is not a mandatory criterion – just something that seems to work fairly well for most people. The “Sale $” column lists the amount of premium received for the sale of the indicated options. In this case, the covered sales against the entire portfolio brings in proceeds of $13,500.
Those proceeds amount to 5.3% of the worth of the entire portfolio. It is not entirely proper to annualize a return such as that, because one cannot be sure that in 4 or 5 months – when the current options expire – he will be able to sell other options that bring in the same level of premium. We will discuss this in more detail shortly. For now, though, note that if we annualize this figure – using the fact that our options have an average life of 5.167 months – we get an annualized return of 12.3%
On the one hand, this may seem like a rather low rate of return for call writing as a strategy. From another viewpoint, though, it certainly represents a lot of income when one considers that those three stocks yield about 2.2%. In reality, it’s about right, considering that the stocks are not very volatile and considering the fact that one gives up most of his upside stock price appreciation by writing these calls.
The other two columns in the table help to determine whether one can, in fact, expect to be able to sell calls, at some future time, for premiums equal to or greater than the ones shown in the table (Sale $). First, there is implied volatility (IV). You can see that IV averages 32% for these three stocks. In the current market environment – where broad-based indices such as the S&P 500 or the Dow-Jones Industrials have implied volatilities of about 24%, this portfolio is only modestly more volatile than the general market. This average of the implied volatilities is a rather crude way to determine if the portfolio is more or less volatile than “the market.”
The “Beta” of a Portfolio
A more rigorous approach to determine how a portfolio relates to “the market” has been presented in the past. It is a way to construct the “Beta” of a portfolio, based on the (historic) volatility of the stocks involved. Without going into a complete rehash of how this method works, suffice it to say that these are the steps involved:
- determine each stock’s “beta” by dividing its 20-day historical volatility by “the market’s” historical volatility. For the purposes of this continuing example, assume that the historical volatility of “the market” is 22%.
- multiply the stock’s capitalization within the portfolio by its “beta” and sum them
- determine the portfolio’s “beta” by dividing b) by the total capitalization of the portfolio
Stock    Value   Hist.Vty    “Beta”   Adj.Value
GE       78000      35        1.59       124091
IP      111000      31        1.41       156409
MRK      65000      23        1.05        67955
Total:  254000                           348455
“Beta” of portfolio = 348455/254000 = 1.37
The computed “beta” uses 20-day historical volatilities. One could use longer-term historical volatilities if he wishes, in order to determine a “beta” that relates better to the longer-term nature of an overwriting strategy. In the case of these three stocks, there probably wouldn’t be a great deal of difference between these short-term historical volatilities and much longer-term ones.
Once having computed the portfolio’s beta, one gains some perspective on how he can expect the premium levels to be. Here, with a “Beta” of 1.37, it appears that the premiums will be slightly higher than average “market” premiums, but not much higher.
The Percentile of Implied Volatility
There is one final measurement of the option premium levels and that is the last column presented in Table 1 – the percentile of implied volatility. In this example, the options in both IP and MRK are in fairly low percentiles (17 and 20, respectively). Only GE has options that are above average – in the 56th percentile. The percentiles average only 31 for these three stocks – and that’s a simple average. Weighted by capitalization, the average percentile of the options in this portfolio is 28.
So, no matter how you look at it, the options used in this example are well below the 50th percentile of implied volatility on average. That alone is enough to justify the assumption that these same premium levels (or perhaps even better ones) will be attainable in the future. Hence, annualizing the figures (from the 4- and 5-month covered writes) is certainly an acceptable approach in this case. As a general statement, it would seem that if the options analyzed were, on average, at or below the 50th percentile, then one could feel fairly safe in annualizing the returns obtained from the first set of covered writes.
Overwriting Philosophy
Once an analysis similar to the above has been performed, the stock holder needs to decide if the projected returns (12.3% in this case) are enough of an incremental return to pursue the strategy.
Assuming that they are, the strategy is a fairly simple one to operate. Generally, one will roll the options out three or – more likely – six months when they lose most of their time value premium. That loss in time value premium could be caused by a decline in stock price (in which case the next option written would most likely employ a lower striking price). Or it could be cause by the passage of time, in which case the option would be rolled out but the same striking price would be utilized. Finally, if the loss of time value premium were caused by the stock rallying and causing the option to become fairly deep inthe- money, then the overwriter should probably do nothing – planning on letting the stock be called away.
On the upside, the alternatives to allowing the stock to be called would include rolling out to a more distant month using either the same strike or a higher one. However, it is unlikely that such a roll would bring in much of a credit unless an extremely long-term option were used. Debits should not be incurred because the projected returns would most certainly not be attained if some of the subsequent option transactions were debits instead of credits. Furthermore, even if a credit is involved, it is probably going to be a fairly small one if both options are relatively deep in-the-money. Again, the projected returns would suffer. It is generally more advisable to allow the stock to be called away and to invest the proceeds into something else.
Reinvesting The Proceeds
As a normal course of events, any proceeds from the sale of the calls should be invested in a money market fund. If they are left in the account, they can be invested in other investments if desired or can be used for spending money – depending on the cash needs of the stock holder.
Once a stock is called away, an even larger cash credit will be available. The stock holder needs to make a decision what to do with those proceeds. If the objective of the account is to generate income with safety, then perhaps he should direct those proceeds to be re-invested in bonds. Eventually, when the entire portfolio is called away, it will then be entirely in bonds and the overwriting program will cease. However, if the stock holder decides that the covered writing strategy makes sense for his overall objectives, then the proceeds can be re-invested in a new covered write – keeping the quality of stock high or perhaps even upgrading it, but probably using a stock other than the one that was called away.
Money Management
McMillan Analysis Corp. has been managing money in the strategy of volatility trading for some time. In the last year, we have also begun to manage money in the overwriting strategy. If this of interest to a reader, please contact via email at info@optionstrategist.com or by calling 1-800-724-1817.
This article was originally published in The Option Strategist Newsletter Volume 10, No. 21 on November 8, 2001.

© 2023 The Option Strategist | McMillan Analysis Corporation