
By Lawrence G. McMillan
This article was originally published in The Option Strategist Newsletter Volume 13, No. 22 on November 24, 2004.
This post-election rally has been a strong one and has produced extremely overbought readings – especially among indicators that use market breadth, such as our breadth oscillators or the Arms Index. In fact, the “stocks only” breadth oscillator recently registered the third highest reading in its history. We have often told you that such overbought conditions at the beginning of a new bullish phase are positive, not negative, indicators. In this article, we’ll quantify that statement by showing how the market performed after previous extremely overbought readings.
The theory behind why an extreme overbought reading at the beginning of a bullish phase is a positive indicator – as opposed to overbought readings at the end of a long bullish move being a negative indicator – lies in the mindset of the average investor. When the market breaks out sharply to the upside, after a long – perhaps dull – period during which it was difficult to be long stocks, both public and professional investors alike are caught flat-footed. There is a pent-up demand for stocks that is fueled by both those who were caught short as well as those who were waiting to buy, but probably were hoping for lower prices. The latter group – those waiting to buy – typically has “too much” cash on hand, and so there is an urgency to buy emanating from both groups.
Their actions manifest themselves quickly by registering overbought conditions – generally in market breadth first, and then in other areas. Since we have a long-standing measure of market breadth in our two oscillators, it is easy for us to do a historical study to see how the broad market has responded when breadth has suddenly gotten very overbought.
Since the oscillators are computed using the net differential between advances and declines, they are somewhat dependent on how many issues are traded. Hence, a +300 reading in 1982 was much harder to attain than a +300 reading today. So, we have somewhat arbitrarily defined +500 as the modern definition of “severely overbought,” while +400 serves the same purpose in the ‘90's, and +300 in the ‘80's.
Given those definitions, the table below shows the times since 1978 that the market registered “severely overbought” readings. In addition, the table shows where the Dow was when the first overbought reading occurred, where it was when the peak overbought reading occurred, and then were it was when the severely overbought condition ended. Finally, the eventual course of the market is described.
There were ten such conditions. On average, the severely overbought condition lasted 18 days, and after that the market moved 19% higher. In seven of the situations, the market rose – and rose strongly – subsequent to the overbought condition’s end. However, in three of the ten instances, the market actually declined (more about that in a minute).
When the market rose, it generally spent a while trading sideways before taking off (notice how many of the descriptions are “flat, then up”). What was happening at that time is that the market was working off the overbought condition and recharging its batteries for a strong move higher. What’s also interesting about the seven bullish situations is this: the oscillators did not register a buy signal before the market started to move higher. In other words, the severely overbought condition was so bullish that it was not necessary for the market to register an oversold condition before it could move higher. All it had to do was work off the overbought condition. That alone released enough pressure.
Turning our attention to the three times when the market declined after a severely overbought condition, there seems to be one common characteristic, although it’s not something that happens right away: the oscillator did fall into oversold territory shortly after the overbought condition ended. This seems to be a valid delineation between the seven intermediate-term buy signals and the three bearish signals.
The most recent signal occurred just last January, and it turned out to be a bearish one. The market had roared higher into the beginning of this year, and the oscillators registered extremely overbought readings. The Dow topped out at 10,700 in early February. But those levels have not been reached again. In fact, by March, the Dow had fallen to 10,200 and the oscillator fell into oversold territory. At that point, one would have had to give up on a potential buy signal and admit that the overbought condition was not of the bullish variety.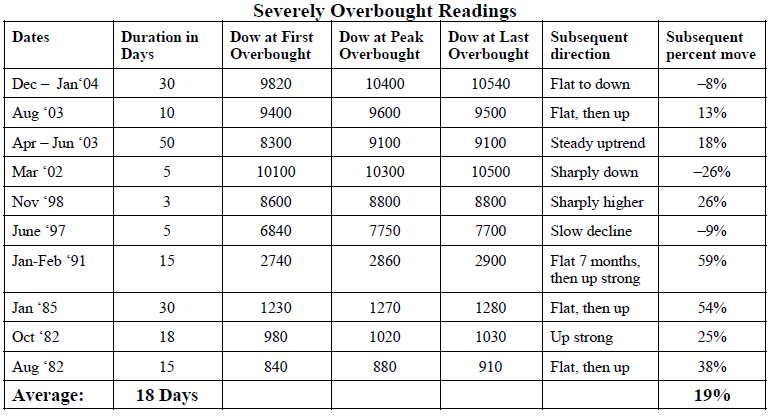
Another interesting fact can be ascertained from the previous table. Note that the Dow usually advances between the time of the first overbought condition until the peak overbought occurs (of course, in real time, one wouldn’t know that the peak oscillator reading was occurring at the time). However, after that, there isn’t usually much advance between the time of the oscillator peak and the eventual fall of the oscillator back below the “severely overbought” reading. In other words, the market runs out of gas after a while, even though advances continue to pummel declines.
Since decimalization occurred, in 2001, NYSE advances and declines have been overly influenced by bond-related issues. Thus, it might be better to use the “stocks only” oscillator than the NYSE-based oscillator to judge these conditions at the current time. If so, then “severely overbought” would occur when the “stocks only” oscillator is above +400.
The two oscillators are shown on the right, encompassing data from the beginning of 2001 until now. While they are generally similar, there are differences – one of which is that the “stocks only” nearly made a new all-time high last week (far right side of upper chart), while the NYSE-based oscillator did not.
A Strategy
One strategy that seems to make sense in light of these infrequent overbought readings is a long-term one, such as this: buy a short-term broad-based index call as soon as the first severely overbought condition is registered. Hold it until the severely overbought condition ends, and then sell it and replace it with a long-term LEAPS call (a LEAPS call is used because of the uncertain timing of what may eventually be a long-term advance). Hold the LEAPS call until 1) an oversold condition occurs (which would act as your long-term “stop loss” condition) or 2) an upside breakout occurs. If the latter condition (upside breakout) occurs, then one would ride the long calls until the uptrend breaks – using conventional moving averages as trailing stops, for example.
Let’s look at the current condition to see how this strategy might have worked and what it might dictate for the future. First of all, whether one defines “severely overbought” as the NYSE-based oscillator above +500 or the “stocks only” oscillator above +400, the first severely overbought condition most recently occurred on November 4th. On that day, $SPX closed at 1161 and the Dow at 10,315. The severely overbought condition persisted until last Friday, November 19th, when the market sold off rather sharply and declines outnumbered advances by a wide margin. That preponderance of declines over advances knocked both oscillators down and out of the severely overbought status. On that day, $SPX closed at 1183 and the Dow closed at 10,457. So the short-term part of the strategy would have resulted in a profit of 22 $SPX points or 142 Dow points (that is a slight out-performance by $SPX, which is something that the strategist would have to adjust for, given market conditions at the time that the shortterm purchase is made).
Now that the short-term part of the strategy is over, it is time to buy the LEAPS call. This is somewhat trickier since LEAPS options can be quite expensive. However, here are some of the possible choices:
Index  Index Price  LEAPS Call       Call Price
$SPX      1177      June (‘06) 1175   100.60
                    June (‘06) 1225    73.50
$OEX       561      Dec (‘06) 560      57.50
                    Dec (‘06) 580      46.00
These are admittedly very high-priced options. The one nice thing about a LEAPS option is that one can buy an out-ofthe- money call and still have a delta of 0.50 or higher. The delta of the OEX Dec (‘06) 580 call is 0.50.
So, let’s use that OEX Dec (‘06) 580 call as an example; that call costs 46 currently. If this long-term buy signal resulted in a 20% advance that took nine months to complete, at what price would this call be trading? Factoring in the proper dividends (which can be estimated through the “implied dividend” function of our Option Evaluation Program, a general Black- Scholes Model software program available for $125 via our web site), the call would be selling for 105 with $OEX trading at 667 (a 20% increase over today’s price) in August, 2005. Hence the profit potential is excellent.
On the other hand, if $OEX were to decline 5%, say, in a month, that might be enough to stop us out. In that case, the Dec (‘06) 580 call would be trading at 31 – a loss of about a third of the original value. Of course, these estimates would result in more favorable projections if implied voaltility should rise – something that might be possible, considering that $VIX is so low currently.
These are rough numbers – as all projections regarding LEAPS options with such a long-term holding period must be – but they do illustrate that there is plenty of profit potential in buying such a call and the potential loss is well less than the entire price of the option.
     Position S420: Long-Term $OEX Call Buy
     Buy 2 $OEX Dec (‘06) 580 calls (YOLLG)
                 at the market
$OEX: 562.70      Dec (‘06) 580 call: 46.10
Sell the calls if the “stocks only” oscillator falls below –400. Otherwise instructions will be given on Hotlines and in future newsletters.
This article was originally published in The Option Strategist Newsletter Volume 13, No. 22 on November 24, 2004.

© 2023 The Option Strategist | McMillan Analysis Corporation