
By Lawrence G. McMillan
We have often talked about the seasonality of $VIX in past issues (although not for a while). Figure 5 shows the Composite $VIX for a year. A composite chart is constructed in a simple manner:
1) average the $VIX for the first trading day of the year and plot it
2) repeat the procedure for each successive trading day of the year
Obviously, in any one year, the composite chart may not accurately portray the entity being charted, but it can be useful to describe seasonal patterns.
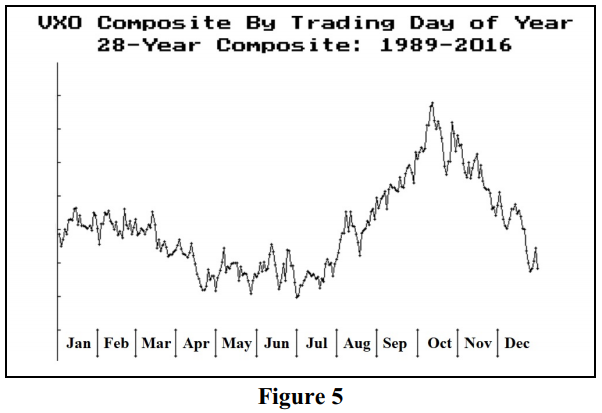
For example, in Figure 5, it is obvious that $VIX typically bottoms near July 1st, and begins to climb from there – eventually reaching its peak in mid-October. The last time that $VIX followed this path explicitly was in 2014. However, the general patterns seem to hold in concept, and it is of importance since we are still in July currently.
For example, in 2015, volatility was low in July and then exploded in August. October itself did not see a rise in $VIX. In 2016, volatility was also low in July. Then it saw modest, but significant increases in September and again in November (leading into the election).
The last time that volatility didn’t increase in the fall was 2009, as it was declining from the extremely high volatility caused by the Financial Crisis. Even so, there was a move from below 20 to above 30 in $VIX. One of the most benign volatility seasons was 2006, where volatility decreased from 19 to 10 during the July – October period. 2003 showed a similar, non-volatile seasonality.
So, there is no guarantee that $VIX will increase from now to October, but the odds have greatly favored it in the past and it would not be surprising to see this year come into line with the seasonals, despite the current historically low levels of $VIX.
This article was originally published in the 7/28/17 edition of The Option Strategist Newsletter.

© 2023 The Option Strategist | McMillan Analysis Corporation